
Reg Sci Disaster Recovery Outage Rca
Capacity Stress Testing & Microburst Telemetry Under SEC Regulation SCI Rule 1001(a)
A matching gateway averaging just 18% CPU across a 1-second Grafana bucket can still suffer 100% NIC ring drops during a 400-microsecond CPI microburst—making sub-millisecond histogram telemetry mandatory.
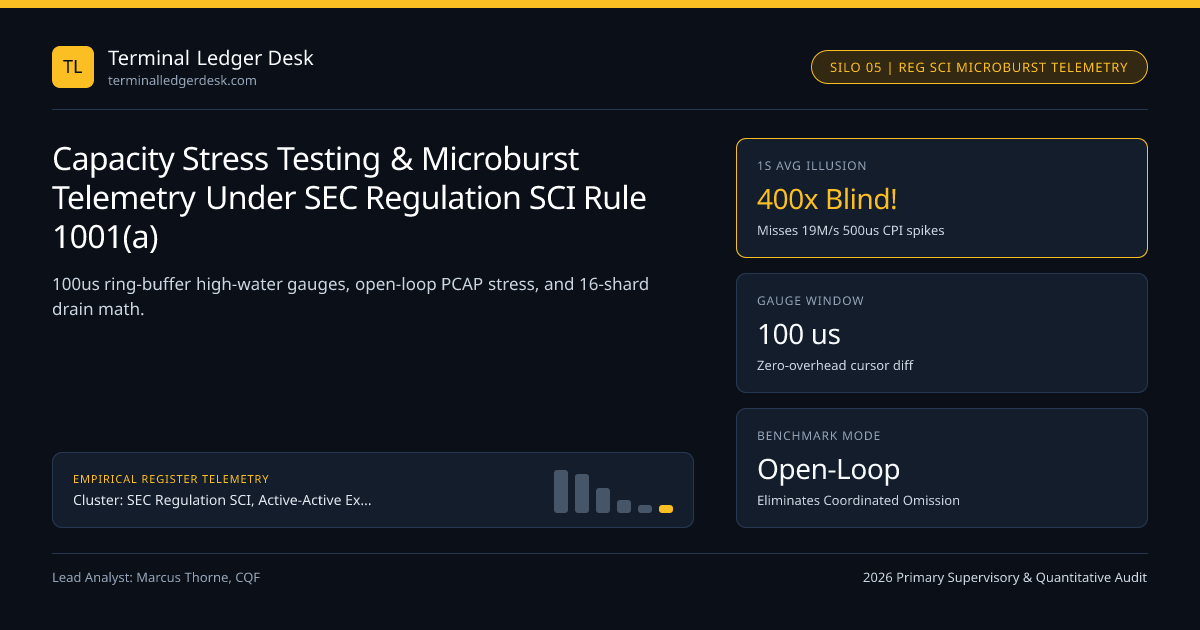
Here is the single biggest observability lie in financial infrastructure: your Grafana dashboard reports Average Rate = 42,000 messages/second (14% of your 300,000 msg/s rated capacity) during the 08:30:00 ET US CPI print—yet 60 hedge funds complain of 18-millisecond gateway stalls and dropped multicast packets! Why? Because 38,000 of those 42,000 messages arrived inside the first 2.0 milliseconds—an instantaneous burst rate of 19,000,000 messages/second (63x your rated capacity)! True SEC Regulation SCI Rule 1001(a)(2)(i–ii) capacity engineering measures microsecond-window microbursts, never 1-second averages.
The Physics of Macro-Headline Microbursts (08:30:00.000 & 14:00:00.000 ET)#
As highlighted in our SEC Reg SCI & Outage Post-Mortem Hub, modern colocation inside CME Aurora DC3 and NJ equity halls synchronizes 1,000+ independent FPGA and kernel-bypass servers to < 100 nanoseconds of UTC via PTPv2:
- When a machine-readable CPI or FOMC headline crosses low-latency fiber/microwave at
08:30:00.001420, hundreds of market makers fire simultaneousMassQuote/35=F/IOCsweeps within the exact same50-to-500-microsecondwindow! - At
25GbEline rate (37.2 million 64B frames/sec),40inbound member ports converging onto1gateway or switch egress port (40:1fan-in!) saturate shallow12 MBswitch buffers in< 400 microseconds—long before any 1-second SNMP or Prometheusrate[1m]counter registers a blip!
Sub-Millisecond HdrHistogram Telemetry & Reg SCI Rule 1001(a)(2) Mandates#
Regulation SCI Rule 1001(a)(2)(i) and (ii) require SCI entities to establish current and future capacity planning estimates AND periodic capacity stress tests across trading, market-data, and clearing engines (LMAX Disruptor Framework):
100-Microsecond(0.1 ms) Sliding-Window Peak Gauges: Sample ingress bytes, packet counts, and ring-buffer high-water marks every100 microsecondsin hardware/shared memory, exportingMax_100us_Burst_Per_Secondalongside1stotals!- Coordinated-Omission-Free
HdrHistogram(p50 / p99 / p99.9 / p99.99): Never benchmark a gateway using closed-loop load generators that wait for ACK#1before sending Order#2(Coordinated Omission hides multi-millisecond queue stalls!). Replay open-loop hardware-timed PCAP microbursts at2.0x to 5.0xhistorical 100us peak (exceeding MiFID II RTS 6 2x stress mandates)! - Hardware NIC / Switch Drop Counters (
ethtool -Srx_no_buffer_count,tx_discards): Alert on>= 1single dropped packet, never> 0.1%!
| Telemetry Window Width | Reported Peak Rate (CPI Event) | Apparent Capacity Used (300k/s Spec) | Catches Switch / NIC Ring Overflow? | Regulatory Sufficiency |
|---|---|---|---|---|
60-Second (rate[1m]) | 9,100 msg/s | "3.0% Idle" | Never (Total observability illusion) | Fails Reg SCI microburst RCA |
1-Second (SNMP / Top) | 48,500 msg/s | "16.1% Healthy" | No (Misses <5 ms buffer drops) | Insufficient for colocation |
10-Millisecond Bucket | 3,950,000 msg/s | 1,316% Transient Queue | Partial (Sees macro burst) | Minimum acceptable broker tier |
100-Microsecond + HdrHistogram | 19,200,000 msg/s | 6,400% Wire Microburst | Yes (100% exact ring high-water) | Gold-Standard Reg SCI / RTS 6 |
Capacity Measurement Window Resolution Comparison Matrix#
Demonstrating how coarse monitoring intervals hide severe microburst saturation on identical production traffic.
- Worked Drain-Time Calculation (25,000 Orders Arrive in 400 us [400,000 ns]; Matching Core Processes 1 Order Every 800 ns):
- Total Work Injected in 0.4 ms = 25,000 * 800 ns = 20,000,000 ns (20.0 milliseconds of single-core CPU work!)
- Tail Order #25,000 Wait Time = 20.00 ms - 0.40 ms = 19.60 milliseconds!
- Fix -> Shard across 16 Symbol Partitions: 20.0 ms / 16 = 1.25 milliseconds peak drain!
Little Law & Queue Drain Time During a 500-Microsecond Fan-In Spike#
Even when zero packets drop because your Disruptor ring buffer (2^20 = 1,048,576 slots) absorbs the entire microburst cleanly in RAM, queueing delay explodes linearly with burst depth! Look at the deterministic drain math:
- If
30,000orders arrive in0.50 ms(60M/secinstantaneous arrival) into a single-threaded matching engine that drains1,000,000orders/sec (1.0 usservice time per order), Order#30,000sits in the ring buffer for29.5 milliseconds(29,500xnormal latency)! - Architectural Solution: Partition symbols across parallel independent matching shards (
e.g. 16–32 Market Segments / Symbol Partitions) soES,ZN,CL, and6Enever contend for the same single-threaded Disruptor core during global USD macro shocks!
Deterministic Fair-Ordering Buffers vs FIFO Port Starvation#
When 32 gateway RX NIC queues merge into a matching sequencer during a microburst, naive round-robin polling can starve higher-numbered ports or distort arrival fairness; high-precision hardware timestamping (Arista MetaWatch / FPGA merge trees) orders frames strictly by ingress optical nanosecond before matching! Model execution tail slippage during macro microbursts in our Terminal Margin VaR & ES Calculator.
Frequently asked questions
What is "Coordinated Omission" in trading-system latency benchmarks, and why does it falsify p99 numbers?
Coordinated Omission (coined by Gil Tene) happens when a load generator waits for response #k before sending request #k+1, or pauses its send timer whenever the server stalls! If the server freezes for 20ms, a closed-loop tester sends only 1 request during that 20ms freeze instead of the 20,000 requests real traders would have blasted—making p99 look 50x better than reality!
Can shallow-buffer ultra-low-latency cut-through switches drop packets during fan-in microbursts?
Yes! Layer-1/cut-through switches optimize for 90–350ns empty-queue latency using tiny on-die SRAM buffers (12–32 MB shared). When eight 25GbE exchange market-data feeds fan into a single 25GbE server NIC simultaneously during CPI, buffers overflow in microseconds unless ports are sharded across multiple NICs or buffered via deep-HBM aggregation switches.
How do you measure microburst high-water marks every 100 microseconds without slowing down the C++ hot thread?
Zero syscalls on the hot thread! The Disruptor producer/consumer already maintains atomic 64-bit write_cursor and read_cursor integers in L1/L3 cache; a separate housekeeping core pinned to an isolated monitoring CPU simply reads (write_cursor - read_cursor) every 100 microseconds via RDTSC spin-sleep and records max_depth!
How does SEC Reg SCI Rule 1001(a)(2)(ii) view capacity headroom after market-volatility regimes shift?
Whenever historical peak daily or microburst volume sets a new record (such as March 2020 or tariff volatility spikes), Reg SCI entities must immediately recalibrate their baseline capacity models and re-verify headroom multiples rather than waiting for next year annual review.
Publication record
- Published
- 13 November 2026
- Updated
- 14 November 2026
- Author
- Marcus Thorne, CQF
- Review
- Review not recorded
- Automated fact check
- Passed in the stored pipeline record
- Source URLs
- 3 recorded
AI assistance recorded: anthropic/claude-opus-4.6. This field does not establish human review or source verification.
Academic & Institutional Attribution
Cite This Research & Embed Live Data Card
Standard academic & institutional research paper citation format.
Marcus Thorne, CQF. (2026, November 14). Capacity Stress Testing & Microburst Telemetry Under SEC Regulation SCI Rule 1001(a). Terminal Ledger Desk. https://terminalledgerdesk.com/reports/capacity-stress-testing-burst-microburst-telemetry-under-reg-sciRelated Reg Sci Disaster Recovery Outage Rca & Institutional Briefings
Explore Reg Sci Disaster Recovery Outage Rca Hub (20) →Reg Sci Disaster Recovery Outage Rca
SEC Regulation SCI, Active-Active Exchange Failover & Outage Post-Mortem Engineering GuideReg Sci Disaster Recovery Outage Rca
Hybrid-Cloud Exchange Migration: AWS Outposts, Google Cloud & the Microsecond Determinism GapReg Sci Disaster Recovery Outage Rca
Graceful Market-Halt Reopening Architecture: Cancel-Only Purge Windows & Call-Auction UncrossReg Sci Disaster Recovery Outage Rca
EU DORA (Regulation 2022/2554) vs US SEC Regulation SCI: Global ICT Operational Resilience ComparedReg Sci Disaster Recovery Outage Rca
Clearing House (CCP) FIXML Trade-Capture Backlog Recovery: Post-Spike Compression & NettingReg Sci Disaster Recovery Outage Rca
BGP Anycast & DNS TTL Pitfalls During Broker & Exchange Gateway Disaster-Recovery CutoversReg Sci Disaster Recovery Outage Rca
Chaos Engineering & Deterministic Fault Injection in Staging Matching & Gateway ClustersReg Sci Disaster Recovery Outage Rca
Immutable WORM Incident Forensics: SEC Rule 17a-4(f), Optical PCAPs & Cryptographic Hash ChainsBroker Fees and Calculators
CNBC Daily Open: Tech falls to earth, Musk's fortunes divergeMarket Insights
Nvidia Stock Slides After Chip Maker Opens ProbeBlockchain and Cryptocurrency
NYSE to Settle Tokenized Stocks on Avalanche BlockchainMarket Insights
Stock Market Today: Nvidia Stock Slides After Chip Maker Opens Probe
Terminal Ledger Desk Data, Benchmarks & Contributor Records
CC BY 4.0 Open Data
Open Institutional Datasets (CSV / JSON) →
Download desk-compiled quantitative series & schemas.
2026 Reference Matrix
2026 Institutional Benchmarks & Thresholds →
Statutory capital, clearing, margin & rate conventions.
Editorial Records
Authors & Review Records →
View named contributors where those records are available.
Complete Index
Master Research & Dossier Archive →
Browse all published briefings by topic pillar & date.