
Matching Engine Clob Colocation Ptp
Wire-to-Wire Latency Telemetry: HdrHistogram, Coordinated Omission & Optical Taps
Internal application timers lie by up to 50x during microburst stalls due to Coordinated Omission and unread NIC ring queues; institutional latency audits correlate passive optical wire taps into lock-free HdrHistograms.
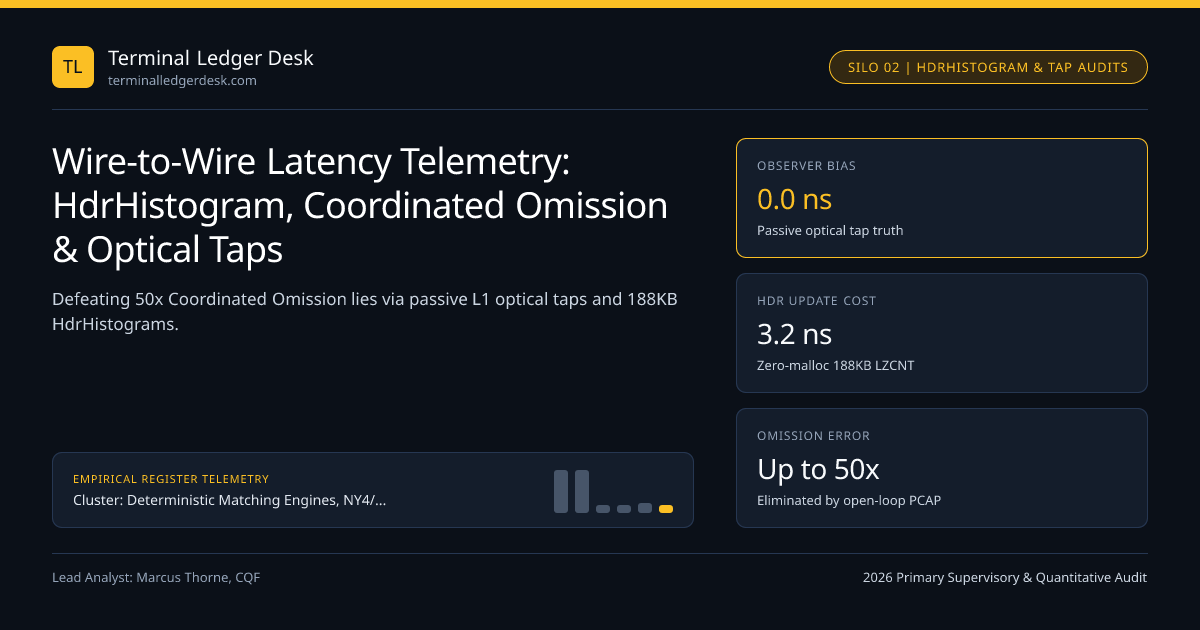
Every trading CTO has heard a vendor brag: "Our OMS processes orders in 1.2 microseconds at p99.9!"—only to put that binary into Equinix NY4 during 09:30:00 market open and discover external optical taps measuring 185 microseconds wire-to-wire! How did internal benchmarks miss a 150x tail stall? Two classic measurement sins corrupt 90% of amateur latency benchmarks: *measuring t_start after* the application calls recv (completely hiding time spent sitting unread in the NIC RX ring while the thread was stalled!) and Coordinated Omission (firing the next load-generator request only after the stalled one finishes!). Institutional desks enforce Wire-to-Wire Optical Truth aggregated inside Gil Tene HdrHistogram**.
Internal rdtsc Lies vs External Wire-to-Wire Optical Tap Truth#
Suppose your trading thread freezes for 100 microseconds inside a page fault or mutex while 50 market-data packets pile up inside the Solarflare RX ring. Once the thread wakes up:
- Flawed Internal Timer (
t1 = rdtscafterrecv,t2 = rdtscaftersend): Measures1.1 microsecondsfor each of those 50 queued packets—reporting a rosy1.1 us p99.9while completely ignoring up to100 microsecondsof queue residence time beforet1! - True Wire-to-Wire Measurement (Layer-1 Arista 7130 / Optical Tap): Passively splits light off the ingress exchange fiber (
t_rx_wire) and egress exchange fiber (t_tx_wire) into an independent hardware capture card synced via IEEE 1588v2 PTPv2.Delta_true = t_tx_wire - t_rx_wirecaptures 100% of NIC DMA, ring queuing, CPU stall, and TX serialization with zero observer CPU overhead on the trading box!
Defeating Coordinated Omission in Replay & Capacity Stress Harnesses#
Coined by Gil Tene (Azul Systems), Coordinated Omission destroys closed-loop load tests: suppose a replay generator aims to send 1 order every 10 us (100,000 msg/s), waiting for each ACK before sending the next. Orders 1..9,999 take 2 us. Order 10,000 hits a 50,000-us (50 ms) stall! During those 50 ms, a closed-loop generator *politely stops sending the 5,000 orders that would* have arrived in real market open, recording only 1 slow sample out of 10,000 (p99.9 still looks like 2 us!) instead of 5,000 stalled samples out of 15,000** (true p99 = 49.8 ms)!
Fix both replay harnesses and HdrHistogram recording (hdr_record_corrected_value(hist, value, expected_interval)): drive synthetic burst replays strictly from open-loop hardware packet players clocked off real recorded ITCH/MDP nanosecond inter-arrival deltas!
| Measurement / Aggregation Method | Captures NIC RX Queue Stall? | Immune to Coordinated Omission? | Memory & Hot-Path Cost | Safe Multi-Node Rollup? |
|---|---|---|---|---|
Post-recv clock_gettime | No (Misses ring backlog!) | No (If closed-loop replay) | ~45 ns (2x vDSO) | N/A |
Averaged p99 Gauge (StatsD) | Partial | No | Heap vector sort spikes | Mathematically Invalid! |
NIC HW RX Stamp + RDTSCP Ring (Aurora) | Yes (Reads PHC RX stamp!) | Yes (On live / open-loop) | ~14 ns (Core 0 offload) | Yes (hdr_add merge) |
External Optical Tap + HdrHistogram (NY4) | 100% Wire Ground Truth | 100% Immune | 0.0 ns on trading host! | Yes (Lossless exact) |
Latency Telemetry & Histogram Data Structure Comparison Matrix#
Comparing memory footprint, dynamic range, and mathematical quantile safety across naive percentile arrays, Prometheus linear/exponential buckets, DDSketch, and HdrHistogram.
- HdrSubBucketIdx = ( Latencyns >> (63 - lzcnt64(Latencyns) - Psigbits) )
- Backfill_Omission : For k = 1 .. floor((Latency - Interval) / Interval): record(Latency - k * Interval)
- Worked Coordinated Omission Error Proof (10,000 requests @ 10us interval; 1 stall of 50,000us = 5,000 intervals):
- Uncorrected Closed-Loop : 9,999 samples @ 2us + 1 sample @ 50,000us -> p99 = 2.0 us, p99.9 = 2.0 us (LIE!)
- Corrected Open-Loop : 9,999 samples @ 2us + 5,000 samples @ [10us..50,000us] -> p99 = 49,500 us (TRUTH!).
Zero-Allocation HdrHistogram Internals & RDTSCP / LFENCE Cycle Counting#
For fine-grained sub-stage profiling inside C++ (Parser -> Book -> Strategy -> Risk) without slowing down the hot path, calling clock_gettime(CLOCK_MONOTONIC) (~18–24 ns vDSO) four times per tick wastes 80+ ns. Instead, pin cores (constant_tsc, nonstop_tsc) and read the 64-bit x86 Invariant Time-Stamp Counter (__rdtscp(&aux) or lfence; rdtsc, ~7–9 ns), writing raw (rx_nic_hw_ts, stage1_tsc, stage2_tsc, clOrdId) tuples into a lock-free LMAX Disruptor telemetry ring drained by Housekeeping Core 0!
On Core 0, HdrHistogram (High Dynamic Range Histogram) indexes 1 nanosecond to 1 hour (3.6 * 10^12 range!) at 3 significant decimal digits (0.1% precision across the entire spectrum) inside a single fixed ~188 KB flat integer array—updating counts in 3 nanoseconds (O(1) bit-shift + leading-zero LZCNT bucket lookup) with zero runtime allocations! And remember: NEVER average p99 percentiles across 10 servers or 60 one-minute windows (averaging percentiles is mathematically invalid!); always merge raw HdrHistogram bucket counts additively (hdr_add) before extracting p50 / p99 / p99.99! Review full stack context in our Deterministic Matching Engines & Colocation Guide.
Correlating ITCH OrderRef -> Outbound OUCH ClOrdID for True Causal Attribution#
How does an external optical PCAP correlate which specific inbound multicast packet caused which outbound TCP order when 500 ticks arrive per millisecond? Embed a deterministic 16-bit/32-bit hash or TriggerMsgSeqNum inside an unused client reference / telemetry correlation table mapped by ClOrdID (11) on FIX API and binary gateways!
Feed p99.99 wire-to-wire distributions into SEC Regulation SCI capacity reports, price latency tail slippage inside the Algorithmic Kelly Allocation Calculator, and explore all 20 guides in the Matching Engine, Colocation & PTP Topic Hub.
Frequently asked questions
Why is averaging p99 latencies across 60 one-minute intervals mathematically invalid?
Suppose an exchange gateway handles 1,000 orders/minute smoothly at 2 us for 58 minutes, then suffers a burst of 1,000,000 orders in minute 59 with a 400-us p99! Averaging the 60 one-minute p99 numbers gives ~8.6 us—erasing the fact that 99% of the day actual volume experienced a 400-us tail!
What is the difference between x86 RDTSC and RDTSCP when profiling sub-100ns C++ stages?
Plain RDTSC is non-serializing, meaning out-of-order CPU execution can execute RDTSC *before* the preceding order-book code actually finishes! Pairing LFENCE; RDTSC at start and RDTSCP at end serializes prior instructions cleanly in ~8–10 ns without flushing the entire pipeline like CPUID.
Can internal host telemetry approach external optical tap accuracy without buying a capture appliance?
It gets within ~80–150 ns if—and only if—t0 is read directly from the NIC hardware arrival timestamp (Solarflare ef_vi RX hardware stamp synced via PTPv2) rather than CPU poll time, and t1 is read from the NIC TX completion hardware timestamp (SOF_TIMESTAMPING_TX_HARDWARE).
How much disk space do full binary HdrHistogram logs consume for multi-year Reg SCI storage?
Compressed using HdrHistogram native zig-zag + Deflate V2 encoding, a 1-minute 3-significant-digit histogram interval compresses down to ~300–900 bytes—meaning an entire trading year of per-minute p0-to-p100 exact distributions takes less than 120 MB per port!
Publication record
- Published
- 14 November 2026
- Updated
- 15 November 2026
- Author
- Marcus Thorne, CQF
- Review
- Review not recorded
- Automated fact check
- Passed in the stored pipeline record
- Source URLs
- 3 recorded
AI assistance recorded: anthropic/claude-opus-4.6. This field does not establish human review or source verification.
Academic & Institutional Attribution
Cite This Research & Embed Live Data Card
Standard academic & institutional research paper citation format.
Marcus Thorne, CQF. (2026, November 15). Wire-to-Wire Latency Telemetry: HdrHistogram, Coordinated Omission & Optical Taps. Terminal Ledger Desk. https://terminalledgerdesk.com/reports/telemetry-histograms-hdrhistogram-p9999-wire-to-wire-latency-auditsRelated Matching Engine Clob Colocation Ptp & Institutional Briefings
Explore Matching Engine Clob Colocation Ptp Hub (20) →Matching Engine Clob Colocation Ptp
Deterministic Matching Engines, NY4/LD4/TY3 Colocation & PTPv2 Clock Sync GuideMatching Engine Clob Colocation Ptp
LMAX Disruptor Ring Buffers: Mechanical Sympathy in Matching Engine CoresMatching Engine Clob Colocation Ptp
Intrusive O(1) Limit Order Books: Slab Pools, Doubly-Linked Queues & Price ArraysMatching Engine Clob Colocation Ptp
FIFO Price-Time vs Pro-Rata Matching Algorithms: CME Split, LMM & TOP MechanicsMatching Engine Clob Colocation Ptp
US Equities Liquidity Triangle: Equinix NY4, ICE Mahwah & Nasdaq Carteret SLAsMatching Engine Clob Colocation Ptp
Equinix LD4 Slough FX Colocation Topology: LMAX, EBS, Currenex & Prime BridgesMatching Engine Clob Colocation Ptp
Multi-Region Colocation Architecture: CME Aurora, Equinix FR2 Frankfurt & TY3 TokyoMatching Engine Clob Colocation Ptp
Solarflare Onload / ef_vi vs DPDK Kernel Bypass: NIC RX/TX Ring & PIO TuningMifid Rts6 Pretrade Kill Switch Controls
SEC Rule 15c3-5 Market Access Control: Ban on Unfiltered Sponsored Access & Annual CEO AttestationMifid Rts6 Pretrade Kill Switch Controls
MiFID II RTS 6 Compliance: Annual Self-Assessment, 2x Stress Testing & DEA GovernanceMifid Rts6 Pretrade Kill Switch Controls
Inline FPGA Pre-Trade Risk Gateways: Cut-Through FCS Stomping & Sub-Microsecond Credit CollarsMifid Rts6 Pretrade Kill Switch Controls
Dynamic Pre-Trade Price Collars & Fat-Finger Guards: NBBO Reference Anchoring vs Static Ticks
Terminal Ledger Desk Data, Benchmarks & Contributor Records
CC BY 4.0 Open Data
Open Institutional Datasets (CSV / JSON) →
Download desk-compiled quantitative series & schemas.
2026 Reference Matrix
2026 Institutional Benchmarks & Thresholds →
Statutory capital, clearing, margin & rate conventions.
Editorial Records
Authors & Review Records →
View named contributors where those records are available.
Complete Index
Master Research & Dossier Archive →
Browse all published briefings by topic pillar & date.